Many companies spend endless hours manually compiling data from their ERP system, typically into MS Excel spreadsheets, and then manually distributing this data to all interested parties. The consequence is that the data is already out of date when it is received.
realtime data is a browser based business intelligence, data warehousing and mining application. It provides detailed sales history analysis and graphical trend charts of sales data hidden in your data base. It works with a wide variety of ERP systems and can provide a consolidated view of global corporate data where there are multiple systems and currencies employed.
It includes comprehensive administrative tools to restrict user access to selected menus or subsets of data, and it can be tailored to suit your business with dashboard views and customised applications.
realtime data is a comprehensive yet simple to operate “business intelligence” system which makes it the prefered tool for users who want to find information quickly, which generally isn’t easily found in a typical ERP system . It provides easy to operate sales history analysis and detailed “drill-down” through the data in multiple paths and dimensions.
A live demonstration of this software is available here. The software also produces graphical analysis and year to year sales comparison. Trend or pie charts are generated in realtime and always show the latest results.
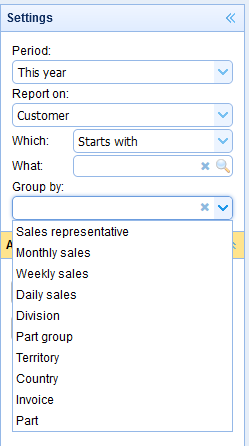
This demonstration system includes two years of sales history which is typical of a medium size business with a large inventory and customer base, and a high volume of turnover. The data may be searched and grouped by one or more of any of the following criteria;
- Customer name or account
- Sales territory
- Customer’s country
- Invoice number
- Product name or code
- Sale’s representative
This software has been successfully adapted to a large variety of commercial ERP systems. It runs on an Apache web server and the data is stored in a MySQL data base. The software includes a data scheduler which automatically updates the SQL data base from the ERP system. A typical system would update the sales history every hour, at least, or more often.
What are the benefits?
Many companies spend endless hours manually compiling data from their ERP system, typically into MS Excel spreadsheets, and then manually distributing this data to all interested parties. The consequence is that the data is already out of date when it is received.
realtime data, as the name implies, provides the data in realtime. It is also accessible to anyone who has access to a web browser, anywhere in the world.
The user chooses the report parameters and has the tools to analyse those results to a great level of detail.
Additional modules provide security and access control. Users or groups of users may be limited to specific subsets of data, or restricted from accessing particular modules altogether.
Will it work with my ERP system?
realtime data has been implemented on a diverse variety of ERP systems, including
- Sage Accpac and Sage tetra
- Netsuite
- Iscala
- MYOB EXO
- Fishbowl/Quickbooks
- Priority ERP
There is no limit to the systems it may operate on. As long as the ERP data is accessible by some manner, e.g. SQL query, ODBC or raw table dumps, the interface to realtime data can be easily adapted, e.g.
- Microsoft SQL server
- Oracle
- IBM iSeries SQL
- Acucobol ISAM
- Informix
- Pick Universe
There is a “data scheduler” module which ensures that the data base used by realtime data is continually updated from the remote ERP system.
The same data is then available from realtime data to any other application by means of ODBC.
Searching for information
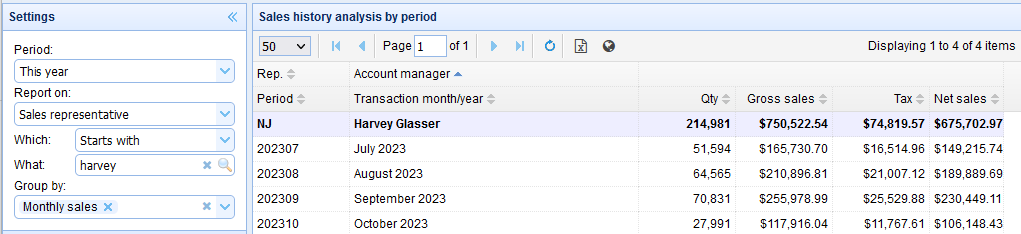
The settings allow you to analyse the sales history over a particular period. In the live demo, this may be either the last 12 months, the current financial year, or a specific month range.
The results will be grouped according to the categorty chosen in the “Report on” setting, and they may be grouped by one or more additional categories in the “group by” selection, e.g. sales person) or by entering a specific search string.
The controls also provide two further levels of data grouping, which could allow you, for example, to identify the the monthly sales to a specific customer or the range of products purchased by that customer. And the results will provide totals and sub-totals for each data group
Navigate and download the results
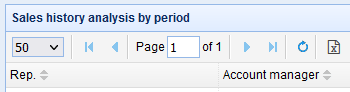
The software quickly produces the results of your analysis which may contain many thousands of items (records), but in general you will only be interested in the items which appear at the top of the results. So only the first 100, or whatever number you chose in the settings, are displayed and the total number of results is summarised at the left of the page with simple buttons which allow you to navigate forwards and backwards through the rest of the results.
And the same results which are displayed on the screen may be downloaded at any time to a MS Excel spreadsheet by simply clicking on the “Download” button.
Sort the results
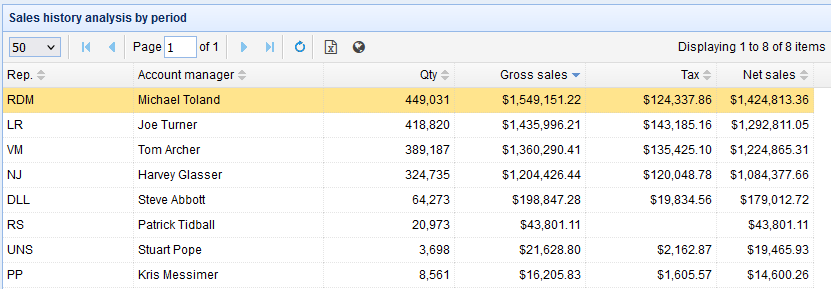
The search results are provided in tabular format with columns and subtotals for each data group, plus a grand total at the top of the page. The results will ordinarily be sorted by the search criteria, e.g. the customer names. This is identified by the arrow on the button, which also indicates the sort order (ascending or descending).
Important data can be quickly revealed by clicking on one of the buttons at the top of the columns. Most significantly, clicking on the “Net sales” column will sort the results by “Net sales” in descending order, thereby quickly identifying the customer who contributed the greatest net sales during the chosen period.
Drill down on the results
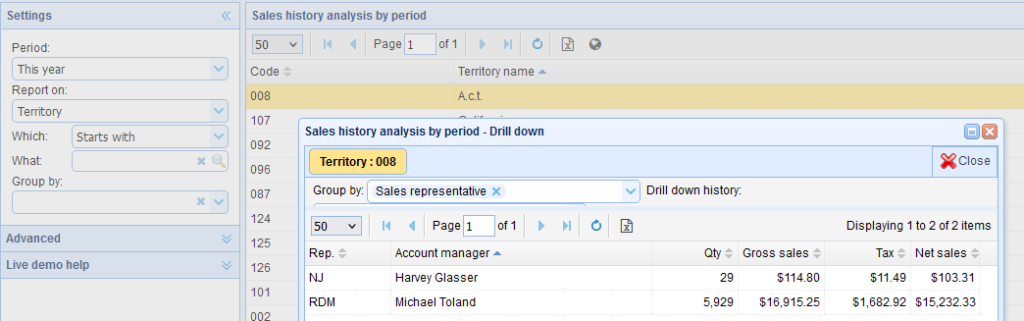
You can click on the results which are displayed to analyse that data subset in more detail. For example, when viewing sales groiuped by “territory”, you can click on one of the territories to view just those sales grouped by “sales person” or any of the other available categories.