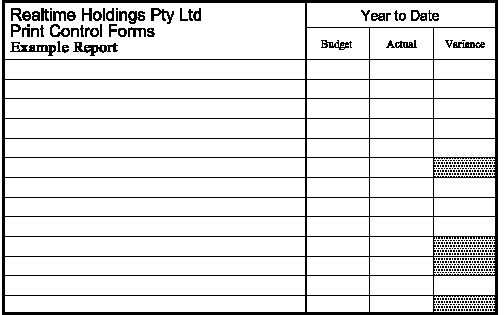
REPORT WRITER TUTORIAL AND WORKED EXAMPLES
INTRODUCTION
GLOBAL
VARIABLES
The Print Control Report Writer is designed to allow users
to utilise the full command set available when building forms, to create
reports. Data can originate from a database, spreadsheet, a word-processing
file or any other ASCII source.
HOW IT WORKS
The Forms capability of Print Control (PCF) gives you the ability to
design complex forms to suit a laser printer. An example laser printer
form is shown in Example 1.
Example 1 - Form created with Makeforms commands.
These forms can be merged with word-processor output at print time to provide
an outline such as a fax form. When used with a word-processor, the word-processor
is providing the text formatting capability and the form is being overlaid
over the page as though a pre-printed form had been placed in the printer.
Often data originates from databases or spreadsheets and these programs
don't have the sophisticated text formatting capability required to take
full advantage of a laser printers proportional fonts, line drawing and
graphics capability.
The Print Control Report Writer provides this capability. It allows
data to be laid out as defined in a report template using Makeforms commands
to be merged at print time with a form to produce a finished result as
shown in example 2.
Example 2 - Form merged with data
There are two components required to achieve the final output.
The first is a file containing instructions which defines the report
layout. This is referred to as the Report Template. The report template
has sections which define page headers and footers, report start and end
sequences and different types of records.
The second is a Data File or data stream which contains the data
to be formatted into a report. Directives may be contained within
the data file to direct the Report Writer as to which sections of the template
to use to lay out the data (otherwise default values are used).
The programming functions used in the template are the same as is used
when constructing printer forms, except that records will be read from
the data file into array variables and these array elements provide the
data wherever text is to be substituted from the data file.
The Report Writer reads the data file and template, and merges the two.
This is acjieved in two passes. The first pass will determine where the
page breaks will occur in the report. The second pass will then reprocess
the entire data file and place headers and footers on each page.
Refer now to the WORKED EXAMPLES - Example 1 for a most simple example.
REPORT
TEMPLATE
The template is the file which contains all instructions which
define how the data is to be layed out on the page.
The template consists of a number of blocks or sections of Print Control
Forms source code which define the layout of the report form and data.
The blocks of source code may include the following (default) named sections;
init - Called before the first pass (first)
start - Called before the second pass
header - Called at the top of each page
record - Called for each new record
footer - Called at the end of each page
end - Called after the second pass (last)
The data can contain directives to instruct the report writer which section
of the template to use for the subsequent data, otherwise the default template
names are assumed. The data file may also contain a directive indicating
which report template to use.
The functions used are the same as is used when constructing forms,
except that data will be read from the data file and wherever text is to
be substituted from the input data file, and array variable containing
data records is referenced to obtain the data. For example, when constructing
forms the following would be commonly used to place text on the page;
text(10, 20,
"a string");
ntext("another string");
Whereas when used to define a report, a record layout might be specified
as;
#record
rec
= data(2);
text(10,
20, rec[0]);
ntext(rec[1]);
))
In this example, the data() function will read two lines from the
data file. These two lines are stored in an array variable named rec.
This will be a two element array, and the elements of this array are then
used as arguments to a text() function to place them on the page.
The file format used by the report writer is called a "glossary" file.
This is a standard ASCII file which is divided into sections (entries)
by putting a hash in the left hand column immediately followed by the section
name, and double closing quotes in the left most column to mark the end
of the section. The glossary section in the receding example is named "record".
The section name must be unique for each section.
The only mandatory entry in a report template is an entry which defines
a record layout, all other sections are optional. However in most cases
a header section will also be defined which will contain instructions
for the page overlay.
If a template is not specified as an argument when Print Control Report
Writer is called (using the "-t" command line switch), the program will
scan the data file for a directive which names the report template (the
".RET." directive).
All device independent report templates are stored under a central directory
named
${Utools}/Utools/templates
Device specific templates are stored in adjacent directories named after
the device driver, e.g.;
${Utools}/Utools/PCL.templates
${Utools}/Utools/PDF.templates
If a filename matching the report template exists in the device specific
directory (matching the device driver nominated by the "-T" command line
switch), it will be used instead of the matching device independent template
in the central directory.
DEFAULT
TEMPLATE SECTIONS
init
The init section defines any functions to be called
by Report Writer before any processing commences. This section is called
once only before the first pass of the data file. Typically this section
is used to declare and initialise global variables, such as Page_End,
discussed later.
start
The start section is processed before the second pass, before the first
page header. It would typically be used to reset any global variables which
might have been modified during the first pass.
header
The header section is processed at the start of each page.
Most reports will require a header. Typically this section of the template
contains forms source code which define the overall layout of a page. This
can also be done by an include() statement or a pcl() statement
which will include the entire layout of a previously declared form. This
latter option is best for optimum speed.
The header section should also contain any initialisation of variables
that may be required at the beginning of each new page.
Note: Where the header defines text or line work below where
the first record data is placed then the constant max_Y should be set to
either zero or the y position of the start of the first record. This is
required as the max_Y value is checked against the value of the constant
Page_End to determine whether the record will fit on the page.
record
This section defines how a particular record's data will be laid out.
There can be as many different records defined as necessary.
It is only necessary to redefine a record type when the required layout
changes.
A data record is taken as the number of items read by the record using
the data() function.
footer
The footer section is processed at the end of each page. Typically this
is only required where reports will cover more than one page.
The footer is output when the data being written will exceed the nominated
maximum y dimension, or a page break directive is encountered in the data
file.
end
The end section is processed after the second pass and so it is the
last section processed altogether. It would typically be used to do any
special post-processing required by the template.
GLOBAL
VARIABLES
As the report writer is reformatting text according to required
dimmensions and font sizes it may be necessary to refer to global variables
which contain dimensional information about each block of text formatted.
This information is necessary if you want to draw line work or position
the next block of text relative to the previous one.
With the use of these global constants to define x and y values it i
possible to design forms which dynamically alter their layout to suit the
data being printed.
The following global variables are available.
| Pass |
Report generation progress, 1st or 2nd pass. |
| Page_End |
Page length where page breaks occur |
| max_Y |
Maximum extent written to on current page. |
| Text_Length |
Length of last text block in text, ntext or ftext
function. |
| Page |
Current page number in report |
| TotalPages |
Total number of pages in report. |
| Copy |
Current copy |
| TotalCopies |
Total number of copies |
Pass
A report is processed in two passes. During the first pass, the page
breaks are determined. If any record exceeds the end of page, that record
will be written as the first record on the next page. Then the entire report
is generated during the second pass.
This global variable is used to store which stage the report writer
is operating in. During the 1st pass it will equal 1, and during the second
it will equal 2.
Page_End
This defines a Y dimension in millimetres as the maximum extent which
may be written to on any page. If any record writes past this point, it
will go to the next page. This variable is usually defined in the init
section of the report, e.g.;
#init
Page_End
= 190;
))
#header
landscape();
...
))
max_Y
This variable stores the maximum extent which has been written to an
a page. The report writer compares this variable against Page_End
and it it exceeds Page_End, the current page will be completed and
that record will be written to the next page. At the end of a page, a footer
will be written if it is defined, and a header will be written on the next
page. The following test may be used to determine if a record has exceeded
the end of page;
#record
...
/*
Keep track of the current record number of each page */
if
((Pass == 1) && (max_Y > Page_End))
recno = 0;
else
recno++
))
Text_Length
The length of any block of text written with a call to text or
ntext
is saved in this global variable. This allows other page elements to be
generated relative to a block of text. For example, the following block
will draw a box around some text;
font(52, 14,
3);
str = "A string of text";
text(x, y, "c", str);
len = Text_Length +
4;
box(x-(len/2), y-3,
len, 5, 0.5);
Page/TotalPages
The report writer looks after pagination of the report, and it records
the current and total page count in these global variables. Note that these
variables are only finallised during the second pass. They will typically
be used to generate page numbers on the header of a report. e.g.;
#header
landscape();
...
text(290,
10, "a", format("Page %d of %d", Page, TotalPages));
))
Copy/TotalCopies
The total number of copies iof a report may be given by the command
line option "-C", or it may be define in the init section to force
a report to generate a specific number of copies. These variables may then
be used in the report to determine which copy is currently being written.
e.g.;
#init
TotalCopies
= 3;
))
#header
...
/*
Rubber stamp the page */
if
(Copy == 2)
graphic(100,100, "customerCopy");
if
(Copy == 3)
graphic(100,100, "officeCopy");
))
DATA
FILE DIRECTIVES
Directives may appear in the data file so that the Report Writer
can process each record type correctly. Directives all start with a period
in the left most column.
| .RE T.templates |
Template definition |
| .RE H.header |
Header section |
| .RE F.footer |
Footer section |
| .RE R.record |
Record |
| .RE PAGEBREAK |
Page break |
| .PA |
Page break, same as .RE
PAGEBREAK |
The space following the ".RE" is optional. The following directives
are recognised by the report writer when encountered in the input source
data stream.
Template
The first directive in the data file should be which template to use,
if it has not been nominated on the command line ("-T") when the program
is run. It takes the form;
.RET.[pathname/]filename
examples;
.RET.pcr_example1
.RET./public/templates/invoice
If a pathname is not given, the report writer will look for a matching
file in the central templates directory. First it will look in the device
specific directory matching the current operating mode (default is "PCL").
If no matching file exists there, it will look in the device independent
directory. i.e. It will look in the following two directories;
-
${Utools}/Utools/PCL.templates
-
${Utools}/Utools/templates
Header
Most reports will require a header. This directive may name another
section in the template file which will be used as the header, although
usually it will use the default name of "header". This directive is then
followed by any data which is to be used for subsequent headers in the
report.
The directive which defines a header entry is;
.RE H.name
where name is a template entry, typically "header". This directive
may then followed by one or more lines of data which will appear in the
header.
Footer
The footer sections are output at the end of each page. Typically this
is only required where reports will cover more than one page. The format
of a footer definition is;
.RE F.name
where name is a glossary section in the template file. This directive
may then followed by one or more lines of data which will appear in the
footer.
Record
Related blocks of data are called records. The template record entry
defines how a particular record is laid out on the page. More than one
record template entry can be used by a data file. This allows for complex
formatting of the source data. The directive which defines a record entry
is;
.RE R.name
where name is a glossary section name in the template glossary file.
This directive is then followed by one or more lines of data which will
be processed by the record template. e.g.;
.RER.lineitem
10
CAX001023
Three phase isolator
3.35
This example shows a record with four data items. The corresponding record
section in the template file will start with a data function call
which retrieve these four lines into an array, e.g.;
#lineitem
rec
= data(4);
qty
= rec[0];
code
= rec[1];
desc
= rec[2];
cost
= rec[3];
...
))
Page Break
A page break can be forced in the data. This is done with either a ".PA"
or a ".RE PAGEBREAK" directive.
A page break forces the footer to be output (provided it is defined),
and then if there is more data, a header for the next page. A page break
would often be followed by a header record containing new data for a header,
such as in a multi-page document such as statements or invoices. e.g.;
.RET.invoice
.REH.
Customer A
Address A
.PA
.REH.header
Customer B
Address B
WORKED
EXAMPLES
This section contains worked examples. The examples are structured
so that the first is a simple one and then the complexity is increased
with each example. It has been assumed that the reader has studied the
examples sequentially as later examples do not repeat explanations of the
data and template layouts.
EXAMPLE 1
WHAT THIS EXAMPLE SHOWS
This example is a simple report. The report defines a header which draws
a box and a single report entry to handle all of the source data.
In this example you will be shown;
-
the structure of a simple data file,
-
how to define a template file containing a header and record section,
-
the report which results.
DATA FILE
This listing of a data file uses a record template called pcr_example1,
the header is called header and the record is called record. The data consists
of 9 items and they are to be laid out in 3 columns.
.RE T.pcr_example1
.RE H.header
.RE R.record
4000
2000
3000
4100
2100
3100
4200
2200
3200
TEMPATE FILE
#init
global Y;
Page_End = 200;
)) |
The init section is called once at the start. The global variable Y
is defined here. And the Page_End value is normally defined here as well.. |
#header
box(10, 10, 80,
25, 0.5);
Y = 20;
font(5, 10, 0);
)) |
The header comprises a box 80mm wide and 25 mm deep. The global variable
Y is also defined as being 20. This will be the Y position of the first
record. Finally the font is defined as being Times Roman 10 point normal. |
#record
rec = data(3);
text(25, Y, "a", rec[0]);
text(50, Y, "a", rec[1]);
text(75, Y, "a", rec[2]);
Y += 5;
)) |
The record defines how the data is to be laid out. The report writer
will treat every three data items read as being a record and will lay them
out across the page at x positions 25, 50 and 75mm.
This record will read 3 fields from the data file into array rec;
Each element of this array will be written in three columns. Lastly, the
Y position is incremented by 5mm. |
The record defines how the data is to be laid out. The report writer
will treat every three data items read as being a record and will lay them
out across the page at x positions 25, 50 and 75mm.
RUNNING THE PROGRAM
To print the example to a laser printer;
pcr -TPCL < $Utools/Utools/demo/pcr_example1 | lp -dlaser
or to create a PDF file;
pcr -TPDF < $Utools/Utools/demo/pcr_example1 > /tmp/pcr_example1.pdf
The result is shown below;
EXAMPLE
2
WHAT THIS EXAMPLE SHOWS
This example is builds on the previous one, the number of data items
has been increase to 15, header text has been added and the report is designed
so that the definition of the record also includes drawing line work so
that it will work correctly with any amount of data provided it is grouped
into 3 data items. Note that if the data is not a multiple of 3, spaces
will be used in place of the missing data.
In this example you will be shown;
-
the use of the header section of the template to draw a header and include
data from the source data file,
-
use of variables to draw linework as part of each data record,
-
use of the footer section of the template.
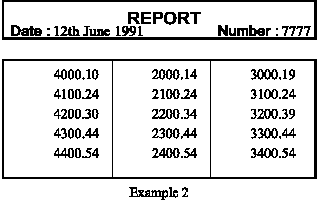
DATA FILE
The data listing has been expanded to include a definition of a footer
called footer, the header includes some text and the numbers have been
altered to include 2 decimal places.
.RE T.pcr_example2
.RE H.header
12th June 1991
7777
.RE R.record
4000.10
2000.14
3000.19
4100.24
2100.24
3100.24
4200.30
2200.34
3200.39
4300.44
2300.44
3300.44
4400.54
2400.54
3400.54
TEMPLATE FILE
#init
global Y, univers,
times, normal, bold;
univers = 52;
times = 5;
normal = 0;
bold = 3;
Page_End = 200;
)) |
The init section defines global variables which will be used when selecting
fonts, and a variable Y which will be used for vertical positions of each
record. |
#header
rec = data(2);
box(10, 10, 80,
10, 0.5);
font(univers,
12, bold);
text(50, 16, "c",
"REPORT");
font(univers,
10, bold);
text(22, 19, "a",
"Date :");
text(80, 19, "a",
"Number :");
font(times, 10,
bold);
text(23, 19, "r",
rec[0]);
text(81, 19, "r",
rec[1]);
hor(10, 25, 80,
0.5);
font(times, 10,
normal);
Y = 30;
)) |
The header has been expanded to draw a box in which the header text
will be contained, this includes predefined strings and two strings obtained
from the data file. (Placed after Date: and Number:)
This is followed by the top of box for the record,and a definition of
the font to be used when printing the records. |
#footer
hor(10, Y, 80,
0.5);
vert(10, Y-5,
5, 0.5, 2, 79.5);
vert(38, Y-5,
5, 0.1, 2, 25);
text(50, Y+5,
"c", "Example 2");
)) |
The footer draws a horizontal line to complete the bottom of the box
and vertical lines to complete the sides and dividing lines. |
#record
rec = data(3);
text(35, Y, "d",
rec[0]);
text(60, Y, "d",
rec[1]);
text(85, Y, "d",
rec[2]);
vert(10, Y-5,
5, 0.5, 2, 79.5);
vert(38, Y-5,
5, 0.1, 2, 25);
Y += 5;
)) |
The record has been modified to include drawing vertical line work
which draws the sides of the box and dividing lines between the columns
of text.
Two vert statements are used, one draws the two 0.5mm thick lines 80mm
apart which define the box edge and the other three 0.1mm lines 25mm apart
which are the vertical dividing lines. |
RUNNING THE PROGRAM
To print the example to a laser printer;
pcr -TPCL < $Utools/Utools/demo/pcr_example2 | lp -dlaser
or to create a PDF file;
pcr -TPDF < $Utools/Utools/demo/pcr_example2 > /tmp/pcr_example2.pdf
The result is shown below;
EXAMPLE 3
WHAT THIS EXAMPLE SHOWS
This example is builds on the previous two, the data items are in a
horizontal format and the separator is defined within the record.
The report has been widened to include a fourth column which has a total
of the rows of data, and the footer has been expanded to include a total
of the four columns.
In this example you will be shown;
-
the use of the variables to calculate total values and include them in
the report output,
-
how to define and call a subroutine within the report,
-
the use of separators to define a data delimiter,
-
more extensive use of the ability to draw the form dynamically to suit
the data being read.
DATA FILE
.RE T.pcr_example3
.RE H.header
12th June 1991
7777
.RE R.record
4000.10
; 2000.14 ; 3000.19
4100.24
; 2100.24 ; 3100.24
4200.30
; 2200.34 ; 3200.39
4300.44
; 2300.44 ; 3300.44
4400.54
; 2400.54 ; 3400.54
TEMPLATE FILE
#init
global Y, univers, times, normal, bold, total;
univers = 52;
times = 5;
normal = 0;
bold = 3;
Page_End = 200;
start();
)) |
The init section is called automatically before the first pass
once during which all the global variables and constants are defined.
The start section is also called via a subroutine call to reset
the total variable which is used to accumulate totals in the report. |
#start
total[0] = 0.0;
total[1] = 0.0;
total[2] = 0.0;
total[3] = 0.0;
)) |
The start section will also be called automaticallybefore the second
pass. Once again, theaccumulated values in the total variable
will be reset. |
#header
rec = data(2);
box( 10, 10, 110, 10, 0.5);
font( univers, 12, bold);
text( 67, 14, "c", "REPORT");
font( univers, 10, bold);
text( 22, 18, "a", "Date :");
text( 105, 18, "a", "Number :");
font( times, 10, bold);
text( 23, 18, "r", rec[0]);
text( 106, 18, "r", rec[1]);
hor( 10, 25, 110, 0.5, 2, 7);
vert( 10, 25, 12, 0.5, 2, 109.5);
vert( 38, 25, 12, 0.1, 3, 25);
font( univers, 9, normal);
text( 24, 30, "c", "Column 1");
text( 49, 30, "c", "Column 2");
text( 74, 30, "c", "Column 3");
text( 102, 30, "c", "Sum");
Y = 42;
font( times, 10, normal);
)) |
The header reads two data items from the data file. These will be the
date
and number which appear in the box at the top of the header.
The remainder of this section draws the column headers, a then sets
global variable Y as the starting position for the first record. |
#dollar(n)
return("$" + str2numb(format("%0.2f", n)));
)) |
This subroutine will convert a number into a formatted dollar currency
string. The number is passed in the argume nt list as n, and the
function returns the formatted string. |
#record
rec = data(1);
rec = parse(rec[0], ';');
sum = 0.0;
for (x=0; x<sizeof(rec); x++) {
rec[x] = (float)rec[x];
total[x] += rec[x];
sum += rec[x];
}
total[3] += sum;
text( 32, Y, "d", dollar(rec[0]));
text( 57, Y, "d", dollar(rec[1]));
text( 82, Y, "d", dollar(rec[2]));
text(109, Y, "d", dollar(sum));
vert( 10, Y-5, 5, 0.5, 2, 109.5);
vert( 38, Y-5, 5, 0.1, 3, 25);
Y += 5;
)) |
Each record in the data file is held in one line with the fields separated
by semi-colons. This record will read one line and then call the parse()
function to break that line into an array.
The sum variable will accumulate the sum total for each record,
which is placed in the last column.
The for loop will then process each field in that array and cast
each field as a floating point number. The sum and total
variables then accumulate this value.
Each of the text functions call the dollar() subroutine
to convert the value into a formatted dollar string.
Lastly, the Y position is incremented by 5mm. |
#footer
hor( 10, Y, 110, 0.3);
vert( 10, Y-5, 5, 0.5, 2, 109.5);
vert( 38, Y-5, 5, 0.1, 3, 25);
text( 12, Y+4, "r", "TOTALS");
Y += 10;
text( 32, Y, "d", dollar(total[0]));
text( 57, Y, "d", dollar(total[1]));
text( 82, Y, "d", dollar(total[2]));
text(109, Y, "d", dollar(total[3]));
vert( 10, Y-10, 13, 0.5, 2, 109.5);
vert( 38, Y-10, 13, 0.1, 3, 25);
hor( 10, Y+3, 110, 0.5);
font( univers, 12, bold);
text( 67, Y+10, "c", "Example 3");
)) |
The footer is called at the end of each page. This will draw that section
of the report which includes the accumulated totals of each column.
The footer is positioned relative to the location of the last record,
so that if more records were added to the data file, it would move further
down the page. |
RUNNING THE PROGRAM
To print the example to a laser printer;
pcr -TPCL < $Utools/Utools/demo/pcr_example3 | lp -dlaser
or to create a PDF file;
pcr -TPDF < $Utools/Utools/demo/pcr_example3 > /tmp/pcr_example3.pdf
The result is shown below;

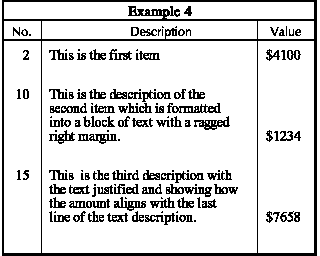
EXAMPLE 4
WHAT THIS EXAMPLE SHOWS
This example shows the use of Pre-defined Constants calculated as text
is formatted. The data file contains a title which is centred and three
lots of data to be formatted. Each record comprises a quantity, a description
and a value. The description is to be formatted into a block of text within
the centre column and the amount is to line up with the last line of the
description.
In this example you will be shown;
-
the use of the text and ftext statements to format text from the data file,
-
the use of max_Y to position the next block of text relative to
the finishing position of the previous block,
-
the use of max_Y to locate text relative to the last line of a formatted
block of text.
-
the use of variable length data.
DATA FILE
This data file uses a record template called pcr_example4, the
header is called header and the record is called record. The data consists
of 9 items and they are to be laid out in 3 columns. The third data item
in each record nominates the number of lines which follow. This allows
for variable length data.
.RE T.pcr_example4
.RE H.header
Example 4
.RE R.record
2
4100
1
This is the first item
10
1234
2
This is the description of the second item which is formatted
into a block of text with a ragged right margin.
15
7658
2
This is the third description with the text justified and
showing
how the amount aligns with the last line of the text description.
TEMPLATE FILE
#init
global Y, univers, times, normal, bold;
univers = 52;
times = 5;
normal = 0;
bold = 3;
Page_End = 200;
)) |
The init section simply declares the global constants which will be
used for text statements, plus the variable Y which will hold the
record position. |
#header
rec = data(1);
box(10, 10, 80, 65, 0.5);
hor(10, 15, 80, 0.3);
vert(20, 15, 60, 0.1, 2, 55);
font(times, 10, bold);
text(50, 14, "c", rec[0]);
hor(10, 20, 80, 0.3);
font(times, 9, normal);
text(15, 19, "c", "No.");
text(50, 19, "c", "Description");
text(82, 19, "c", "Value");
font(times, 10, normal);
max_Y = 0;
Y = 25;
)) |
The header comprises a box 80mm wide and 90 mm deep. A horizontal line
is drawn 5mm down from the top of the box, this will frame the title and
two vertical lines are drawn to divide the box into three columns.
The variable Y is also defined as being 20, which is the Y position
of the first lrecord. Finally the font is defined as being Times
Roman 10 point normal. |
#record
rec = data(3);
str = data((int)(rec[2]));
for (x=1; x<sizeof(str); x++)
str[0] += " " + str[x];
text(17, Y, "a", rec[0]);
ftext("r", 22, Y, 50, str[0]);
text(86, max_Y, "a", "$" + rec[1]);
Y = max_Y + 10;
)) |
The record defines how the data is to be laid out. The report
writer will treat every three data items read as being a record and will
lay them out across the page at x positions 15, 22 and 75mm. An ftext r
statement is used which will format the text into a block 60 mm wide with
a ragged right hand margin. The pre-defined variable _max_Y is used to
position the value in the third column to line up with the bottom line
of the description.
After each record the variable Y is incremented by 5mm. |
RUNNING THE PROGRAM
To print the example to a laser printer;
pcr -TPCL < $Utools/Utools/demo/pcr_example4 | lp -dlaser
or to create a PDF file;
pcr -TPDF < $Utools/Utools/demo/pcr_example4 > /tmp/pcr_example4.pdf
The result is shown below;